Debugging is only supported with Pascal and Basic scripting languages (introduced in SyncBackPro V8). Debugging is not supported with the old Windows scripting, e.g. VBScript.
There are two ways to debug Pascal and Basic scripts:
1.While editing a script, you can debug parts of the script.
2.You can debug a script when it is run in SyncBackPro or as part of a profile.
|
Debugging scripts is an experimental feature. Debugging running scripts is highly complex and complicated further as numerous threads and COM objects are involved. |

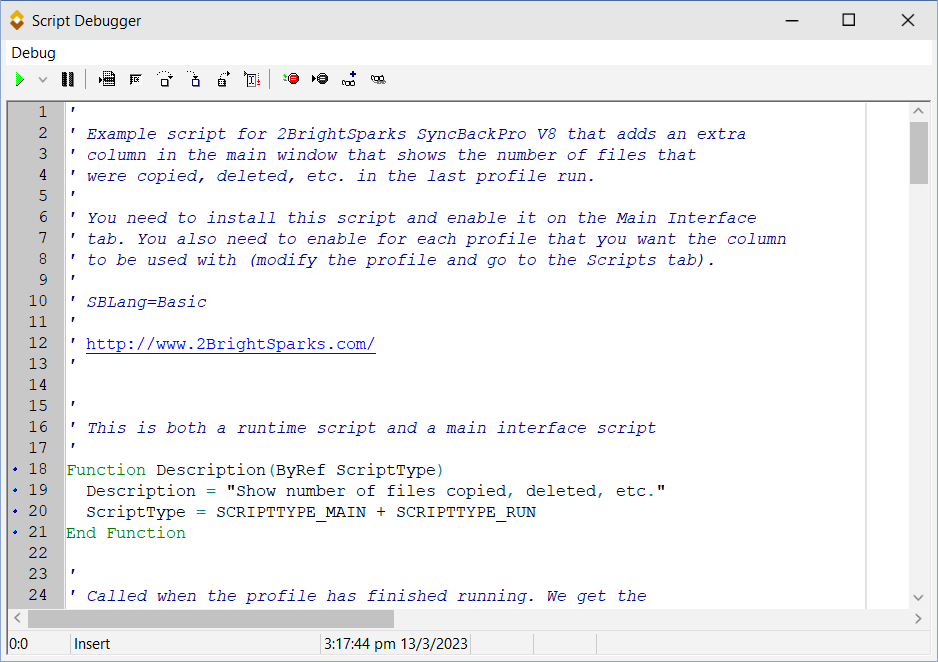
Debugging in the Editor
While in the script editor, click the Debug button:
From the Debug menu, and the toolbar, you can choose the various debug options:
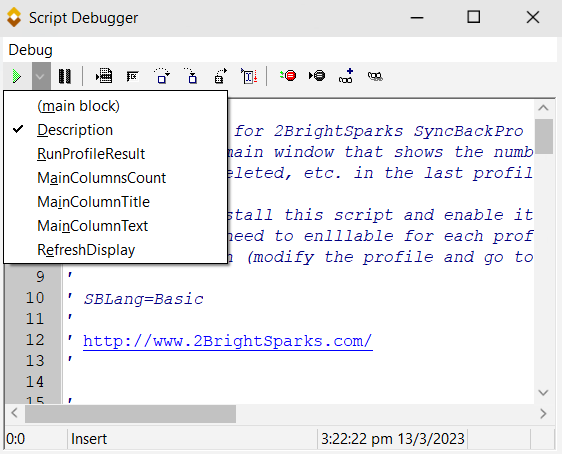
•Run (F9): This will run the script. Note that SyncBackPro scripts do not have a "main" part (main block), meaning a default part that is run when the script is run. Using the drop-down arrow next to the Run (play) button, you can choose which function/procedure will be run. By default the Description function is selected, as all SyncBackPro scripts require that section:
These debug functions, e.g. breakpoints, will be familiar to any developer that has used a debugger. To evaluate variables you can hover the mouse over the variable, for example. You can also add watches (Ctrl-F5) or use Evaluate.
Lines that have a dot next to their line number are lines with executable code. You cannot set a breakpoint, for example, on lines that are not executed, e.g. lines that are comments.
Features are also available from the pop-up menu in the debug editor window.
Keep in mind that this kind of debugging (while editing) is not equivalent to when the script is actually run in SyncBackPro. You can do simulations, e.g. pass parameters to the functions, but this is mostly useful for basic syntax and logic checking, for example.
Any changes made in the debugger will be reflected back to the editor once the debugger window is closed. The breakpoint selections are also saved as these are used when you want to debug a script when it is actually run.
Debugging Running Scripts
To debug a script when it is run you must first go to the Scripts window (via burger menu ![]() -> Scripts in the main window) and select the script (or scripts) you wish to debug. To do this, right-click on the script and select Debug from the pop-up menu. Only Pascal and Basic scripts can be debugged, not VBScript (for example). A warning icon will appear next to the script to indicate debugging is enabled. Once you have enabled debugging, edit the script, go to the debugger and set the appropriate breakpoints. If you are enabling (or disabling) debugging for a main interface script then you will need to exit and restart SyncBackPro for it to come into effect.
-> Scripts in the main window) and select the script (or scripts) you wish to debug. To do this, right-click on the script and select Debug from the pop-up menu. Only Pascal and Basic scripts can be debugged, not VBScript (for example). A warning icon will appear next to the script to indicate debugging is enabled. Once you have enabled debugging, edit the script, go to the debugger and set the appropriate breakpoints. If you are enabling (or disabling) debugging for a main interface script then you will need to exit and restart SyncBackPro for it to come into effect.
When debugging a script (while it is running) the debug window will appear. Note that it may appear more than once for the same script as the script may be called from different windows. For example, with a location script it will call Connect before the file and folder selections window appears.
Watches cannot be used with runtime and location scripts while they are running as part of a profile. However, you can still use evaluate. Also, you may not have the option to close a debug window (you cannot if it is a runtime or location script that is being used by a running profile, for example). Once the profile has finished, or the script is no longer required, the debug windows are automatically closed.
All Content: 2BrightSparks Pte Ltd © 2003-2026